
New hires may be earning closer to your most experienced employees than you realize. Now, with Ontario’s pay transparency requirements, your current staff can see it too.
When the market for a role moves faster than your annual increase budget, offers to new hires can catch up to, or even pass, what long-service employees in the same job are earning. That’s salary compression, and with pay now public, it’s no longer something HR can manage quietly.
Transparency Doesn’t Cause Compression. It Exposes It.
Salary compression happens when the pay gap between newer and more experienced employees in the same role shrinks to almost nothing, or reverses entirely. It has always existed. What changed is how visible it now is.
Before Ontario’s pay transparency requirements took effect, pay ranges rarely appeared on job postings. An employer could offer a strong candidate slightly more than a tenured employee earned, and no one else would know. Since January 1, 2026, employers with 25 or more employees have had to include expected pay on publicly advertised postings, so existing employees can see any gap for themselves.
Compression is not caused by transparency. It is caused by starting pay rising faster than the merit or increase budgets applied to people already in the role. Transparency just removes the place where that mismatch used to hide.
How to Check Your Own Organization
Compression is easy to miss because it shows up gradually, one hire at a time. A quick check, done role-by-role rather than department-wide, catches it before it becomes a retention event.
- Pull actual base pay for every employee in a role, sorted by hire date.
- Compare the most recently hired person’s pay against the median pay of employees with three or more years in the role.
- Flag any role where the newest hire is within 5 percent of that median or above it. That is your compression risk list.
- Check the flagged roles against the floor of your currently posted range. If the range floor sits close to what tenured staff already earn, the next hire will compress the role further.
This only works if the comparison is role by role. A department-wide average can look healthy while individual roles are quietly compressed underneath it.
What the 2026 Salary Report Shows
The COIRI Clarity 2026 Summary Report on Salaried Employees in Ontario breaks pay out by organization size precisely because a single blended figure hides how different small-employer pay actually is. Take the job “Inventory Control Manager” for example.
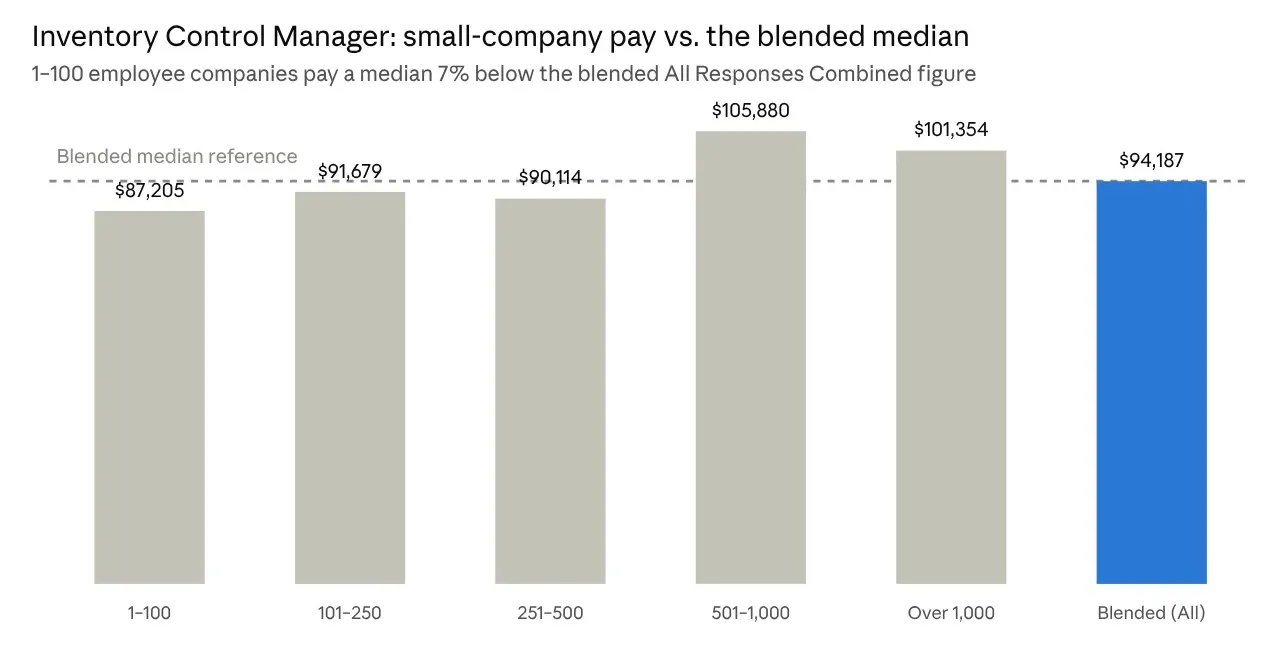
An employer of 100 or fewer employees who benchmarks against a figure blended across all company sizes is anchoring to a number that already sits above what similarly sized Ontario employers actually pay. A posted range built on that number gives a new hire more room above the true small-company median than the budget for existing staff can match.
The size of this effect is not the same for every role. We pulled a few more positions from the 2026 Salary reports to further illustrate how much it varies:
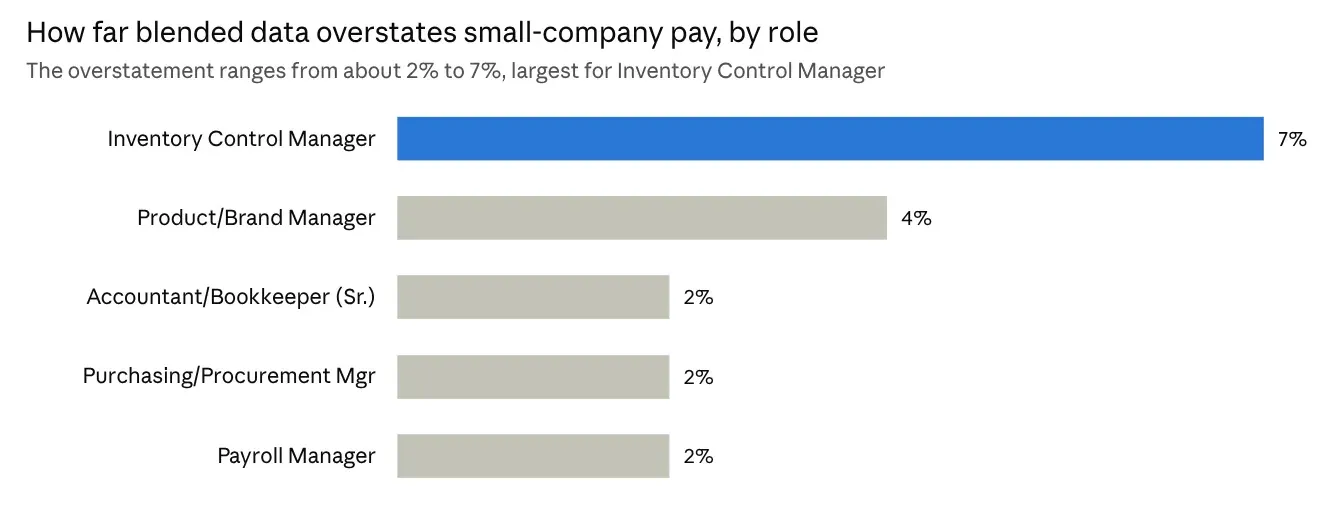
For some positions the gap is small enough to ignore. For others, like Inventory Control Manager, it is large enough to create a compression problem within a single hiring cycle. This is the argument for checking size-segmented data role by role rather than assuming one benchmark fits every position in your organization.
Why Generic Market Data Makes Compression Worse
When a range has to be set on a deadline, it’s reasonable to reach for the data that’s easiest to access: posting data from Indeed or LinkedIn, or aggregated tools like Glassdoor and Payscale. Each has its uses, but each answers a slightly different question than the one a posted range needs to answer.
Posting data reflects the hiring range and not where offers actually close. Aggregated tools tend to blend provinces and organization sizes, so a figure for an Ontario role may be drawn from a very different mix of employers than the ones you compete with for talent. Employer-reported surveys close much of that gap by collecting actual pay data and allowing results to be cut by region, industry, and size. That’s the approach behind COIRI’s Ontario survey data. Whatever source you rely on, the closer it reflects your real labour market, the more defensible the range will be.
The risk isn’t just one number being off. A range set above your true peer group becomes the anchor for the offer, and once that offer is accepted, it sits in your pay structure ahead of employees who have been in the role for years.
What to Do When You Find Compression
Once a role is flagged, three responses are worth considering, roughly in order of cost and disruption.
Targeted retention adjustments. Correct pay for the specific tenured employees affected, rather than an across-the-board increase. This is the fastest fix and the easiest to justify to finance, since it is tied to a named compression event rather than a general raise.
Range redesign. If compression shows up across multiple roles in the same job family, the range is probably positioned too high, or its floor was set too close to what tenured staff already earn. Rebuild the range using size- and region-matched data so the floor, midpoint, and ceiling reflect actual peer pay rather than a generic benchmark.
Phased correction tied to the increase budget. Where a full fix is not affordable in one cycle, build the correction into next year’s increase budget as a named line item rather than folding it into general merit pay, so it does not get diluted across the whole team.
Whichever approach you choose, start with benchmark data matched to your real peer group by industry, size, and region, not a single blended figure.
FAQ
What is salary compression?
Salary compression is a narrow or reversed pay gap between newer and more tenured employees in the same role, usually caused by starting pay rising faster than the increase budgets applied to existing staff.
Is salary compression illegal in Ontario?
No. Ontario’s pay transparency rules require expected pay to be posted but does not prohibit compression itself. The risk is retention and morale, not compliance, though a pattern of compression that falls disproportionately on a protected group, such as older long-service employees or women in a job class, could raise separate human rights or pay equity concerns.
How often should we re-benchmark to avoid this?
Annually, at minimum, for roles that hire frequently or sit in competitive job families. COIRI publishes updated Ontario salary and benefits data every year, specifically so employers are not working from figures that are several years out of date by the time a new range gets posted.